Overview
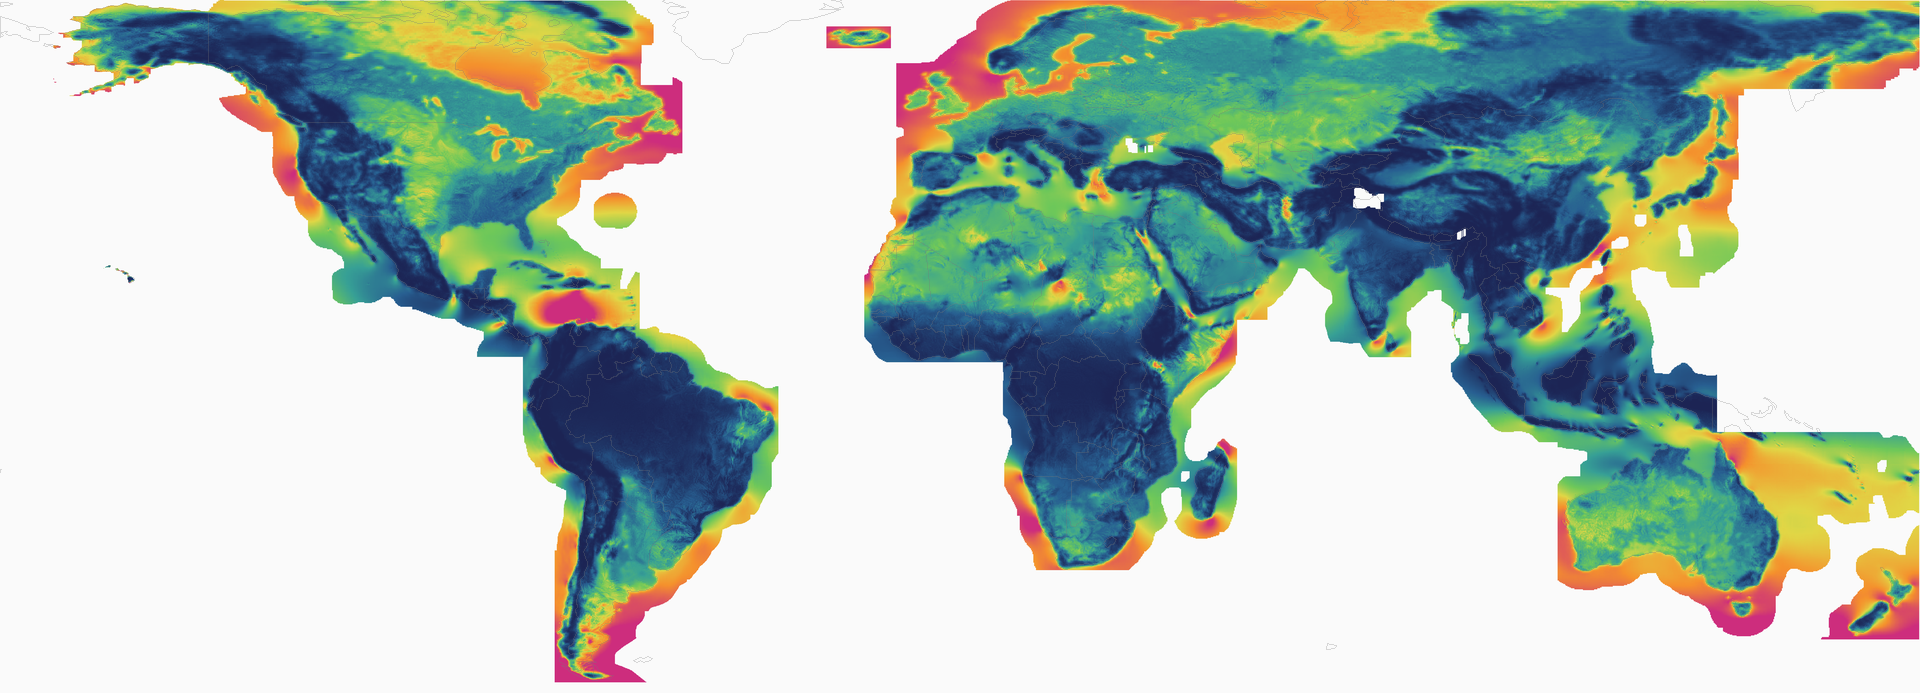
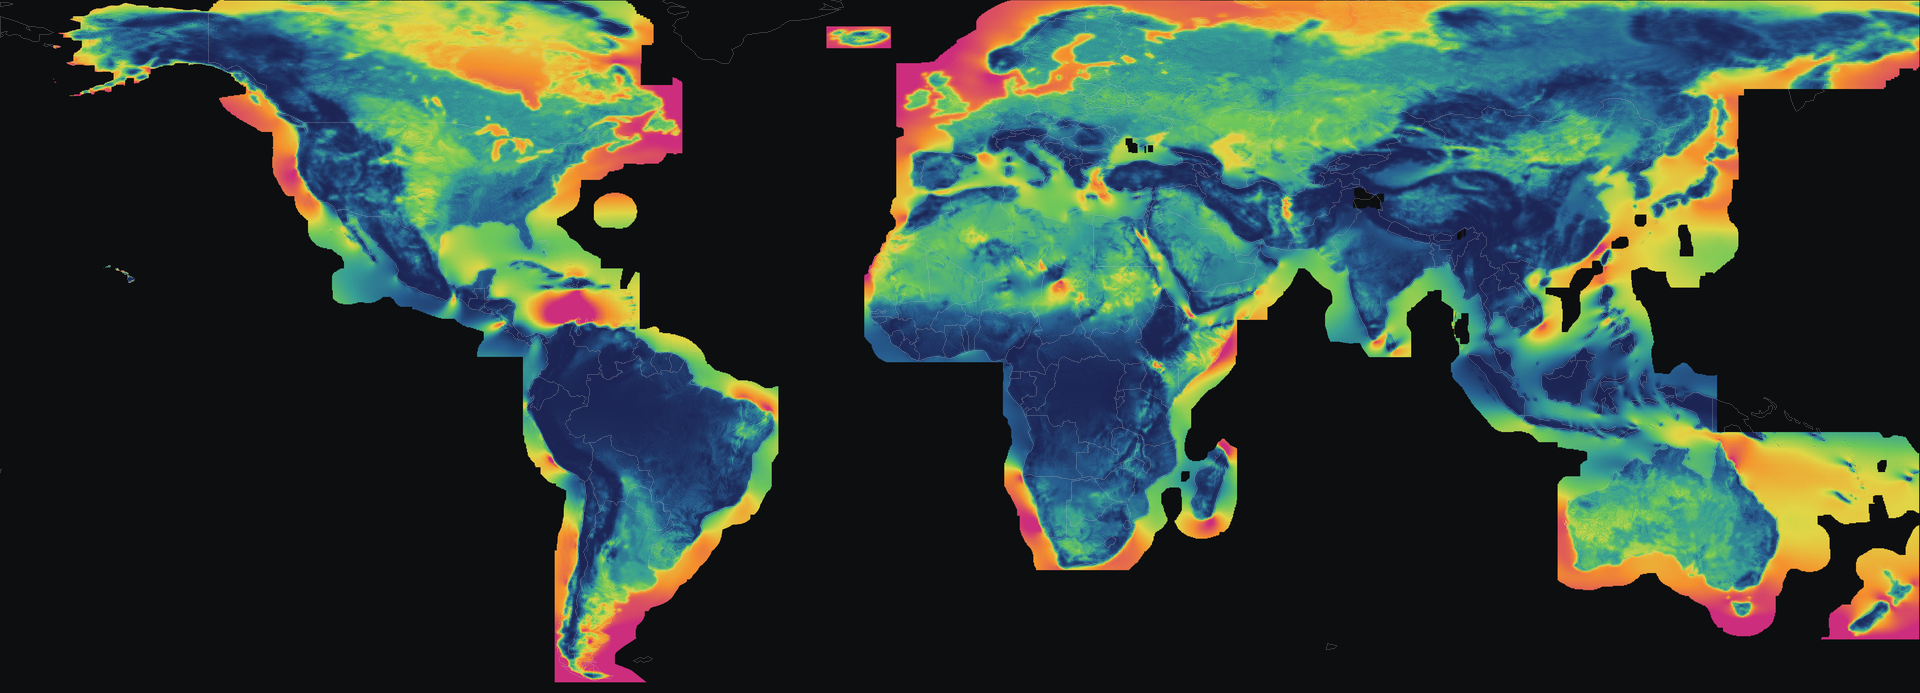
A global, high-resolution map of long-run wind resource: the mean capacity factor a reference turbine would achieve at every location, resolved to roughly 250 m. Where our historical wind capacity factors answer "what would this site have produced, hour by hour?", the atlas answers "where are the good sites?" with one number per location, comparable across regions because it comes from one dataset and one method.
What's included
- Mean wind capacity factor (0 to 1) at ~250 m resolution, for an IEC class 2 reference turbine at 100 m hub height, covering global land plus roughly 200 km offshore
- Interactive map layers and site-screening analytics in Convexity: area-weighted distributions, threshold filtering, exceedance curves and point inspection with percentile ranking
Where the data comes from
This is the Global Wind Atlas, the reference dataset for wind resource assessment, developed by DTU Wind Energy with the World Bank Group. We serve it as it is published, with no re-modelling. The Global Wind Atlas downscales decades of reanalysis weather through microscale flow modelling, so the map resolves the terrain that actually decides a site: ridgelines, valleys, coastal gradients. Convexity adds the serving and the analytics: responsive map tiles at every zoom, and the screening tools listed above.
The capacity factor shown is for a standard reference turbine (IEC class 2, 100 m hub height), which is what makes locations comparable. A real project with its own turbine and hub height will produce different numbers. For hourly, site-specific production, use the historical wind capacity factors.
Get started in Convexity
The atlas is free to explore in Convexity, Bayesian Energy's energy-system modelling application:
- Sign in at convexity.bayesian.energy (free in the browser).
- Open any model's map, or create a new model to start from a blank map.
- Open the Renewables atlas panel from the right-hand edge of the map.
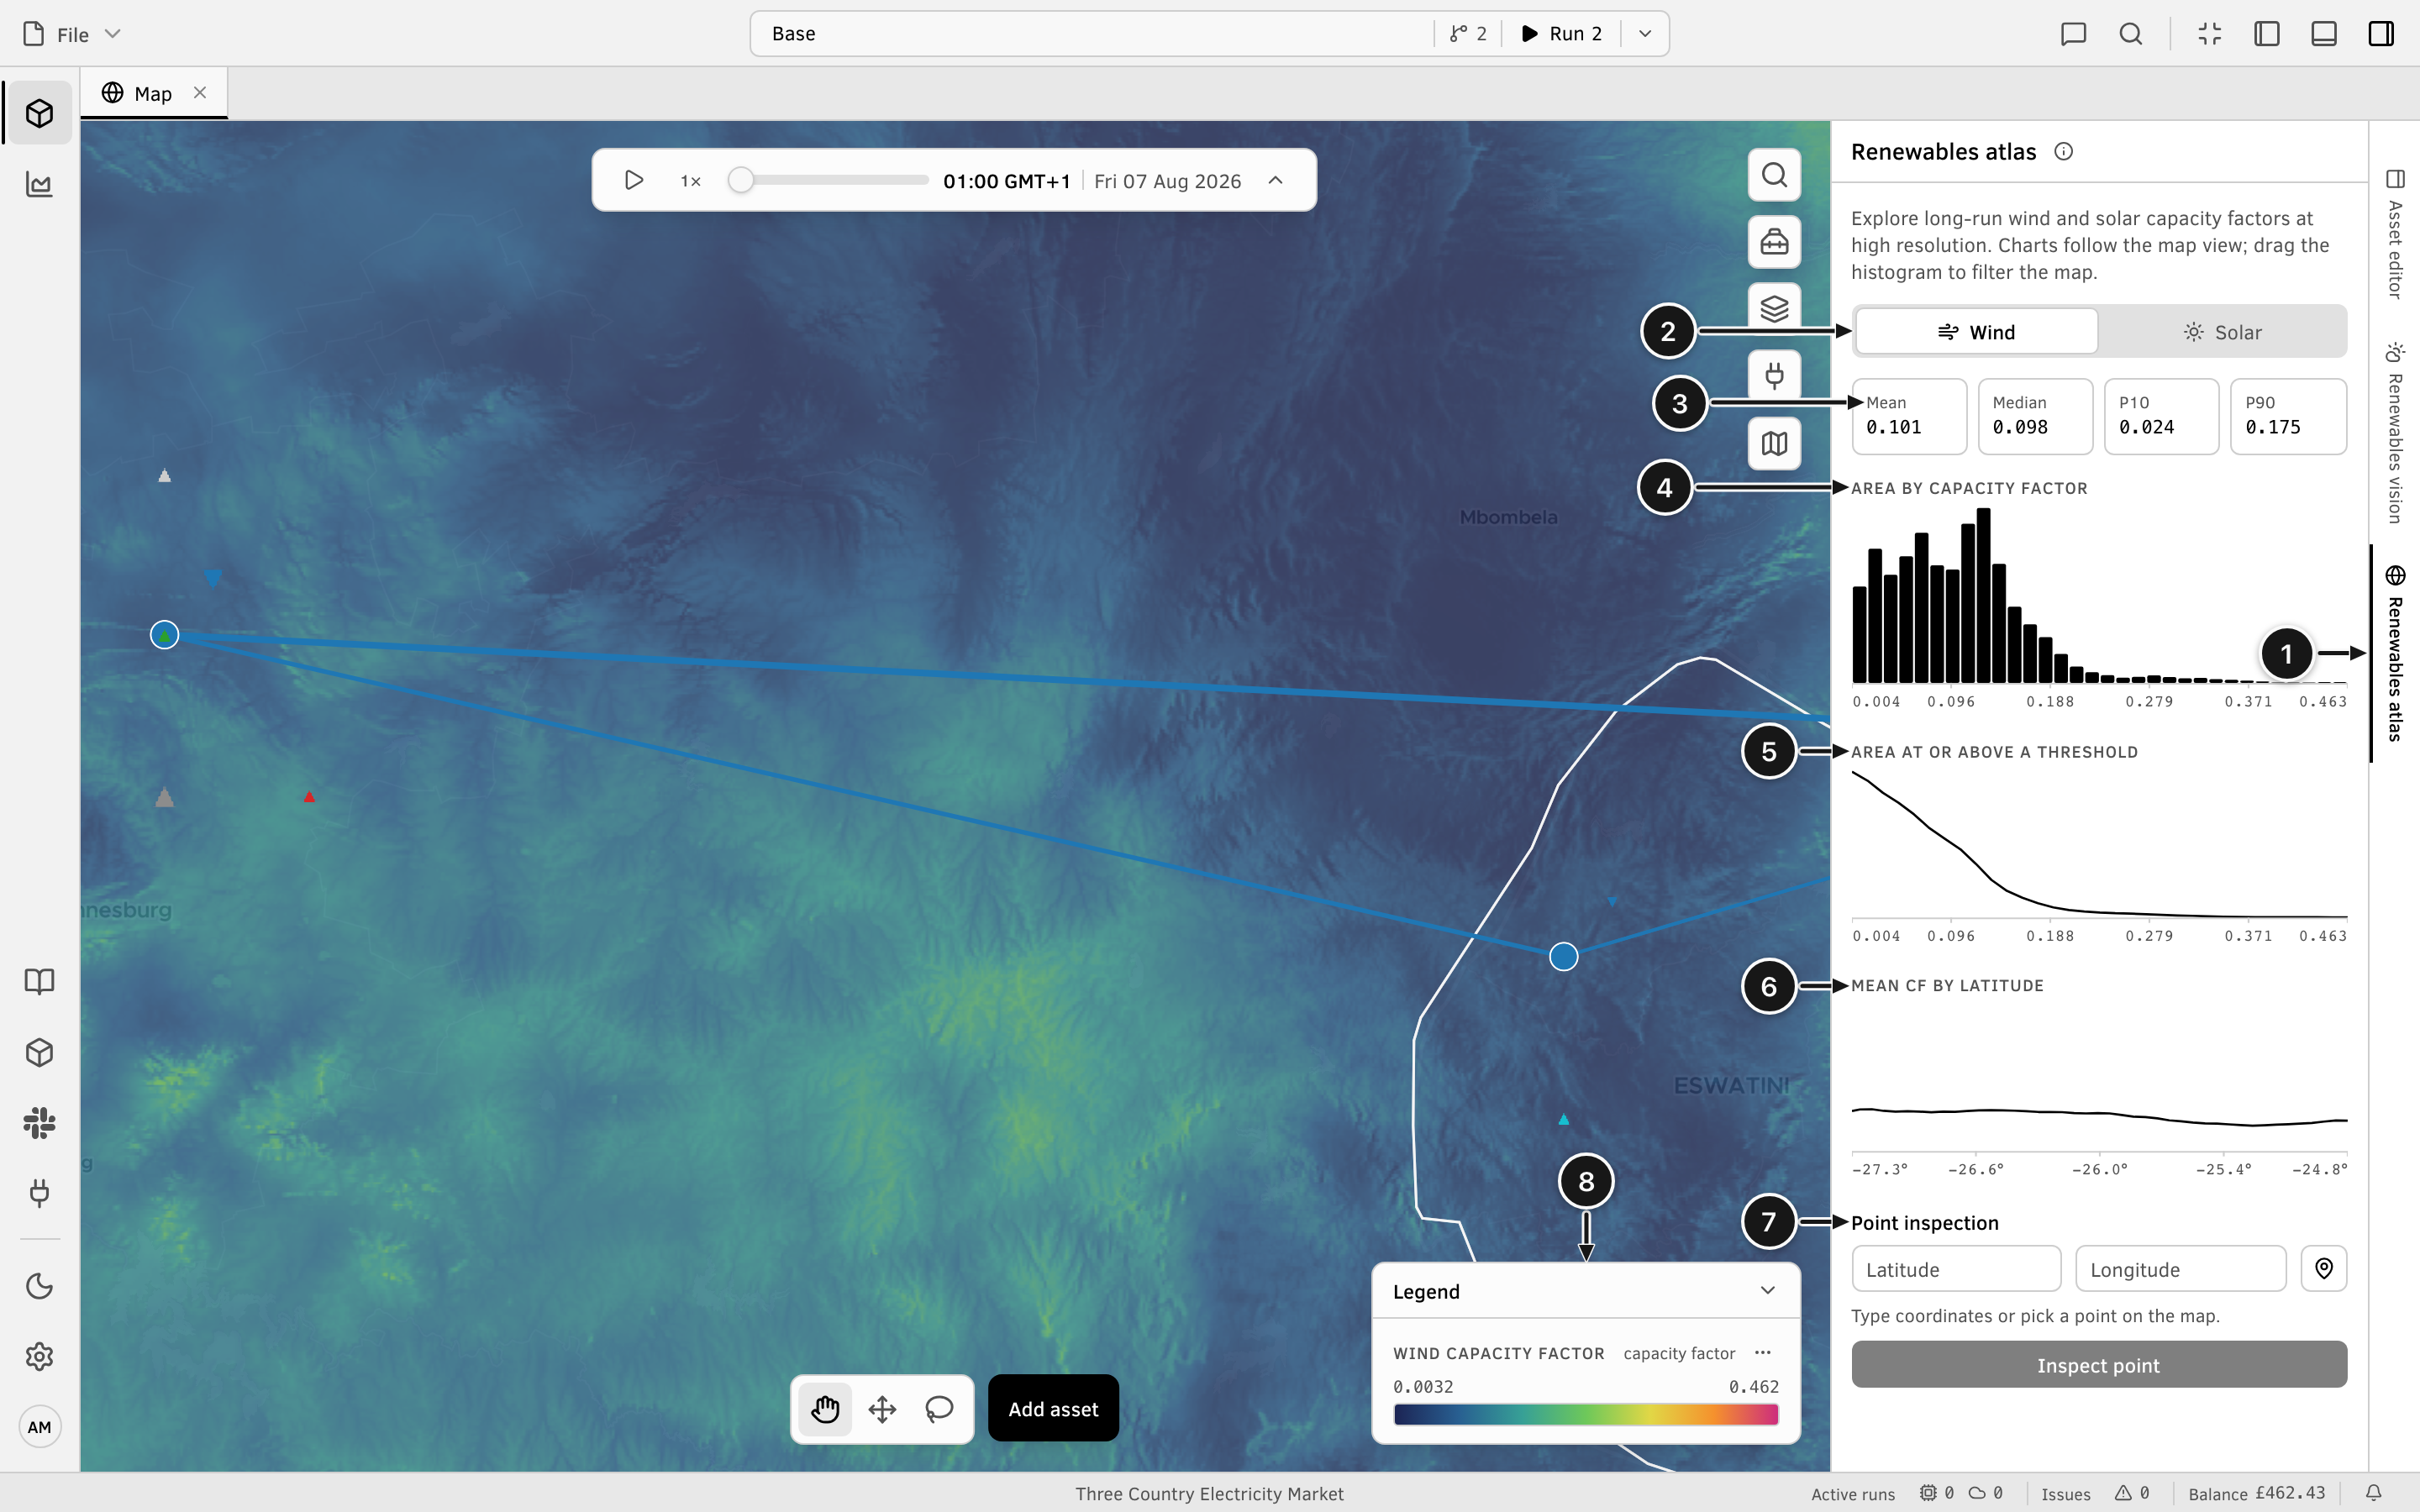
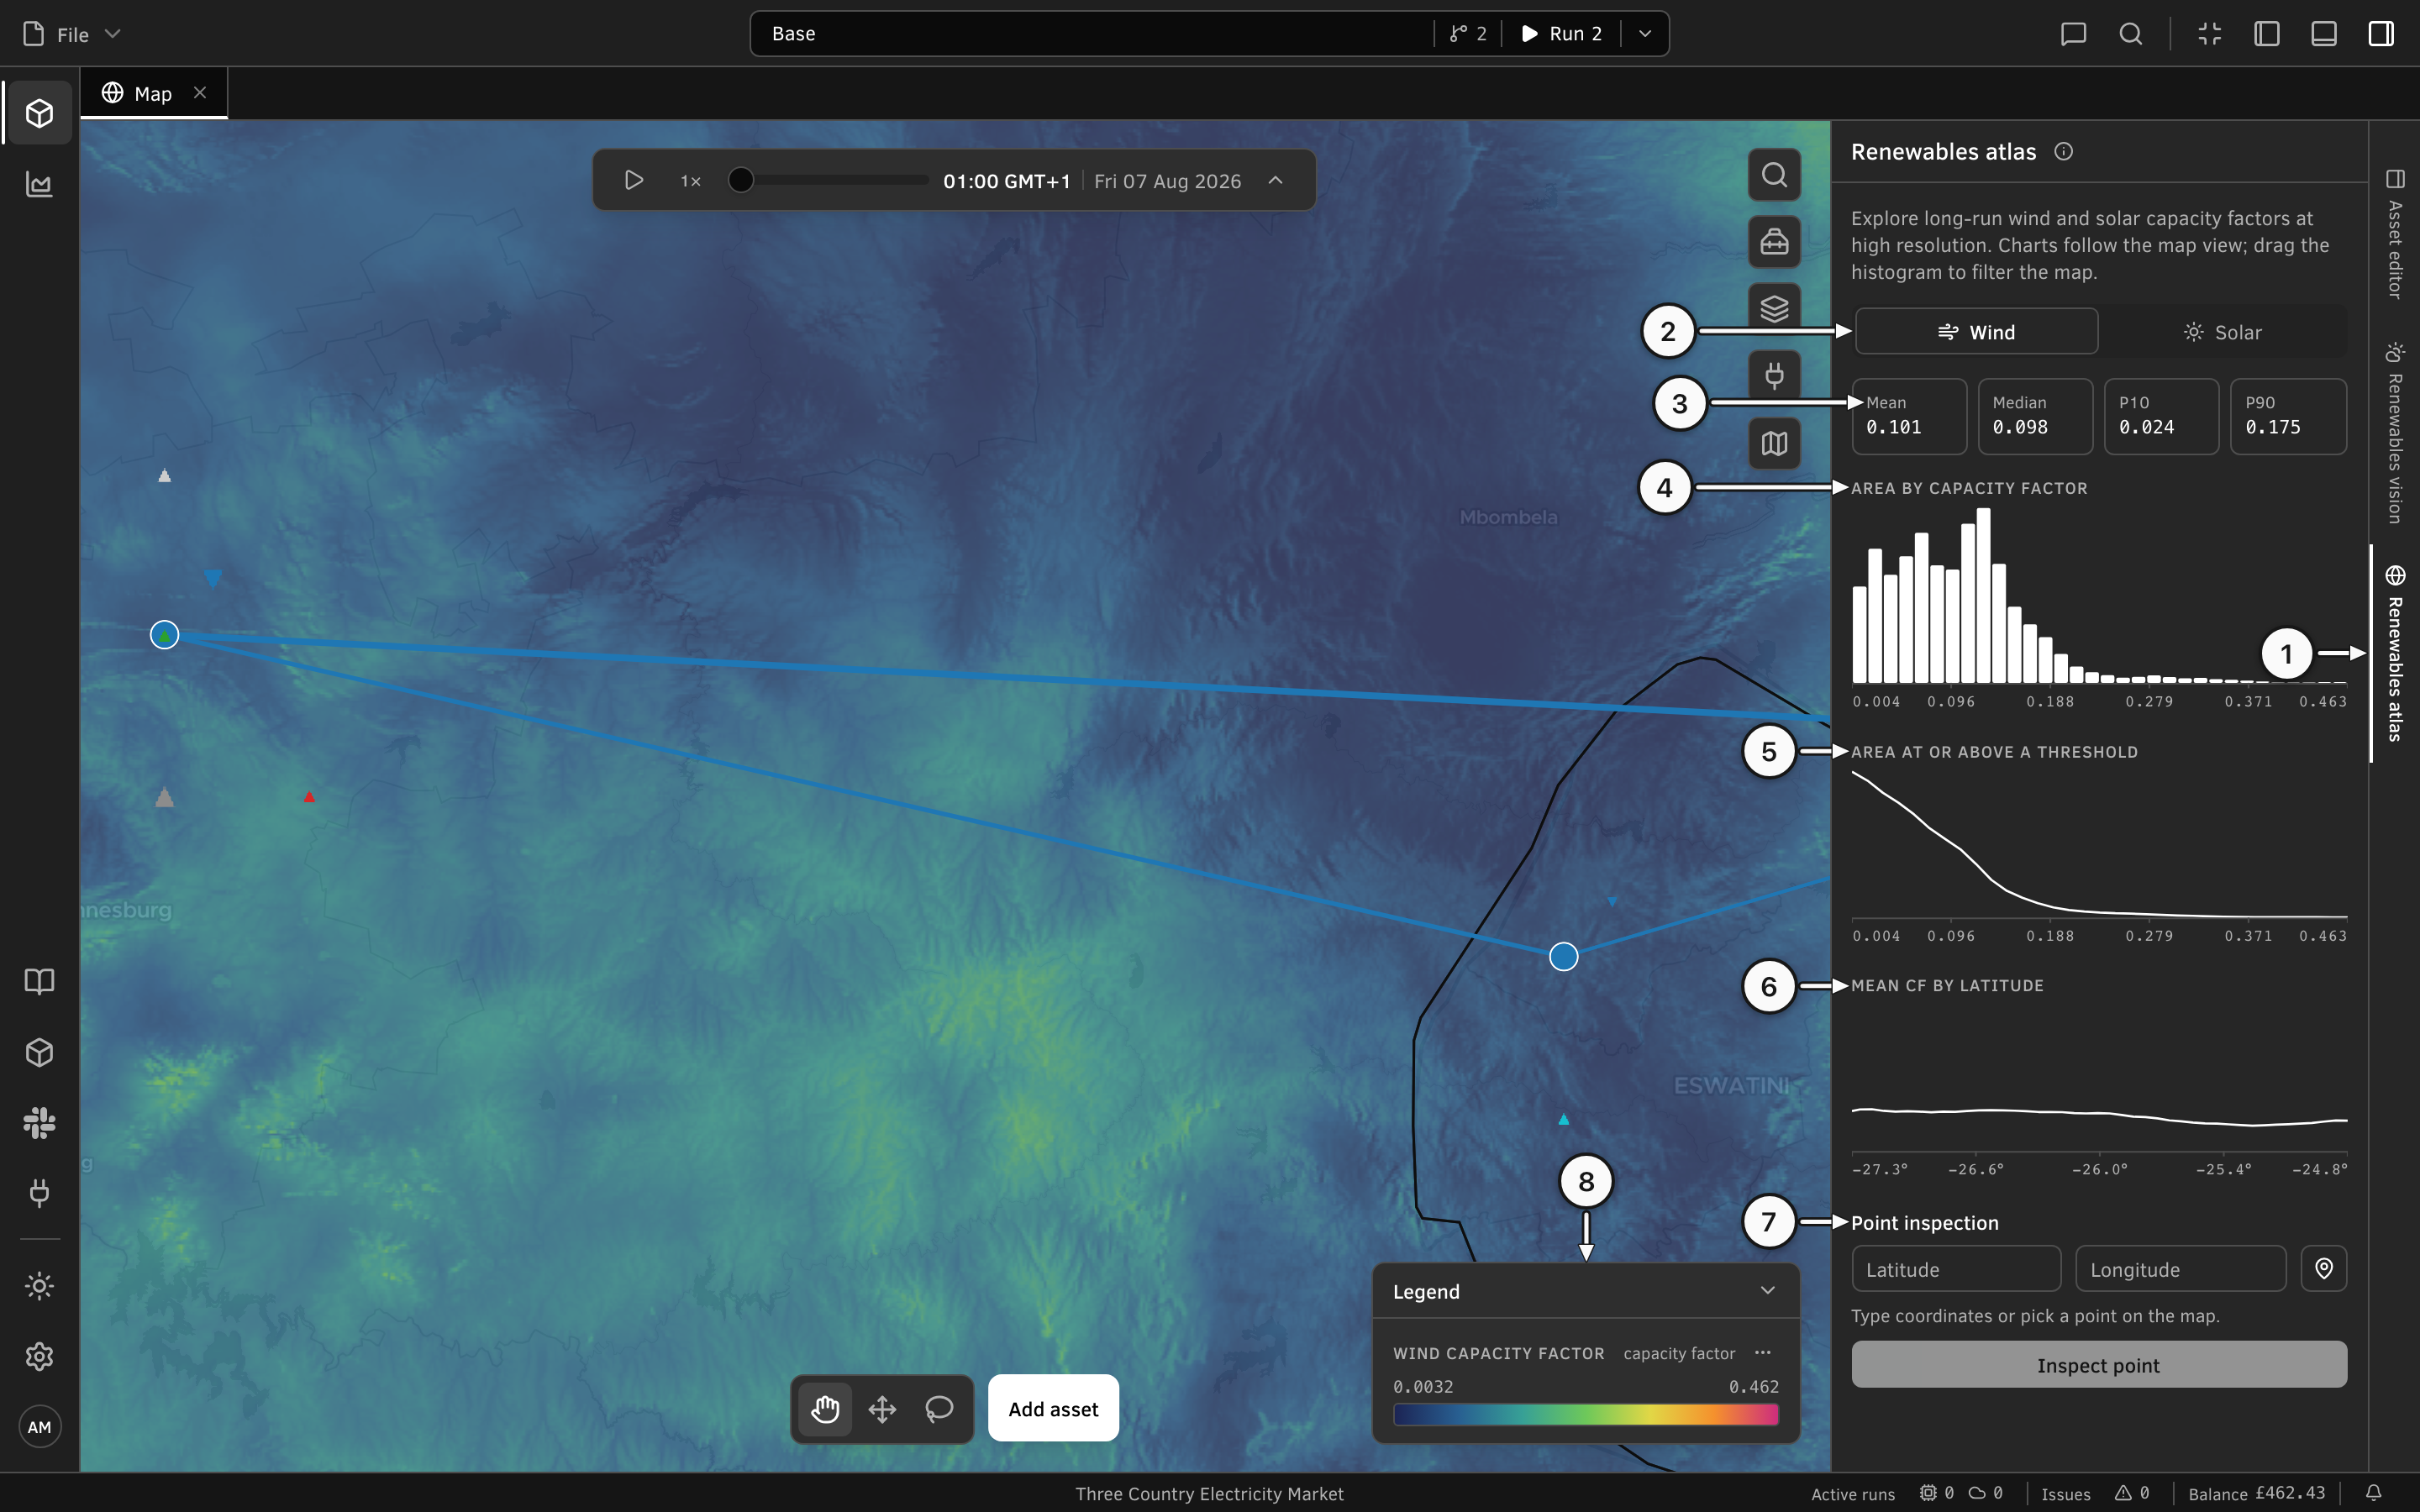
- Renewables atlas tab: opens and closes the panel from the map's right edge.
- Wind / Solar switch: pick the layer; switch to Wind for this dataset.
- Summary statistics: mean, median, P10 and P90 capacity factor for the area in view.
- Area by capacity factor: drag across the histogram to filter the map to a capacity-factor band.
- Area at or above a threshold: how much of the view clears a given capacity factor.
- Mean capacity factor by latitude: the north-south profile of the view.
- Point inspection: type coordinates or pick a point to read its capacity factor and percentile rank within the view.
- Legend: the colour scale, stretched to the range of the data in view.
Coverage and caveats
Coverage is global land plus roughly 200 km offshore, the areas the Global Wind Atlas resolves; the deep ocean is not covered. The atlas is a climatology: one long-run mean per location for a reference turbine, intended for screening and comparison. It is not an hourly series and not a substitute for site-specific yield assessment.
Source and attribution
The Global Wind Atlas (DTU Wind Energy / World Bank Group / ESMAP, with data by Vortex) is released under CC BY 4.0. Bayesian Energy serves it in Convexity as published, with interactive map serving and analytics on top. Free to use, including commercially, with attribution.